|
yaze 0.3.2
Link to the Past ROM Editor
|
|

| |
|
yaze 0.3.2
Link to the Past ROM Editor
|
|
|
| |
Unified performance profiler for all YAZE operations. More...
#include <performance_profiler.h>
Classes | |
| struct | TimingStats |
| Get timing statistics for an operation. More... | |
Public Member Functions | |
| void | StartTimer (const std::string &operation_name) |
| Start timing an operation. | |
| void | EndTimer (const std::string &operation_name) |
| End timing an operation. | |
| TimingStats | GetStats (const std::string &operation_name) const |
| std::string | GenerateReport (bool log_to_sdl=true) const |
| Generate a comprehensive performance report. | |
| void | Clear () |
| Clear all timing data. | |
| void | ClearOperation (const std::string &operation_name) |
| Clear timing data for a specific operation. | |
| std::vector< std::string > | GetOperationNames () const |
| Get list of all tracked operations. | |
| bool | IsTiming (const std::string &operation_name) const |
| Check if an operation is currently being timed. | |
| double | GetAverageTime (const std::string &operation_name) const |
| Get the average time for an operation in milliseconds. | |
| double | GetTotalTime (const std::string &operation_name) const |
| Get the total time for an operation in milliseconds. | |
| int | GetOperationCount (const std::string &operation_name) const |
| Get the number of times an operation was measured. | |
| void | PrintSummary () const |
| Print a summary of all operations to console. | |
Static Public Member Functions | |
| static PerformanceProfiler & | Get () |
| static void | SetEnabled (bool enabled) |
| Enable or disable performance monitoring. | |
| static bool | IsEnabled () |
| Check if performance monitoring is enabled. | |
| static bool | IsValid () |
| Check if the profiler is in a valid state (not shutting down) This prevents crashes during static destruction order issues. | |
Private Types | |
| using | TimePoint = std::chrono::high_resolution_clock::time_point |
| using | Duration = std::chrono::microseconds |
Private Member Functions | |
| PerformanceProfiler () | |
Static Private Member Functions | |
| static double | CalculateMedian (std::vector< double > values) |
| Calculate median value from a sorted vector. | |
Private Attributes | |
| std::unordered_map< std::string, TimePoint > | active_timers_ |
| std::unordered_map< std::string, std::vector< double > > | operation_times_ |
| std::unordered_map< std::string, double > | operation_totals_ |
| std::unordered_map< std::string, int > | operation_counts_ |
| bool | enabled_ = true |
| bool | is_shutting_down_ = false |
Unified performance profiler for all YAZE operations.
The PerformanceProfiler class provides comprehensive timing and performance measurement capabilities for the entire YAZE application. It tracks operation times, calculates statistics, provides detailed performance reports, and integrates with the memory pool for efficient data storage.
Key Features:
Performance Optimizations:
Usage Examples:
Definition at line 44 of file performance_profiler.h.
|
private |
Definition at line 163 of file performance_profiler.h.
|
private |
Definition at line 164 of file performance_profiler.h.
|
private |
Definition at line 20 of file performance_profiler.cc.
References active_timers_, Get(), is_shutting_down_, operation_counts_, operation_times_, and operation_totals_.

|
static |
Definition at line 15 of file performance_profiler.cc.
Referenced by yaze::gfx::PerformanceDashboard::CollectMetrics(), IsEnabled(), IsValid(), yaze::editor::EditorManager::LoadAssets(), PerformanceProfiler(), yaze::gui::CanvasModals::RenderAdvancedPropertiesModal(), yaze::gui::CanvasContextMenu::RenderPerformanceMenu(), yaze::gui::CanvasModals::RenderPerformanceModal(), yaze::gfx::PerformanceDashboard::RenderRecommendations(), yaze::gfx::ScopedTimer::ScopedTimer(), SetEnabled(), yaze::gfx::GraphicsOptimizationBenchmarks::SetUp(), yaze::gfx::GraphicsOptimizationBenchmarks::TearDown(), yaze::gfx::TEST_F(), yaze::gfx::TEST_F(), yaze::gfx::TEST_F(), yaze::gfx::PerformanceDashboard::UpdateOptimizationStatus(), and yaze::gfx::ScopedTimer::~ScopedTimer().
|
inlinestatic |
Enable or disable performance monitoring.
When disabled, ScopedTimer operations become no-ops for better performance in production builds or when monitoring is not needed.
Definition at line 54 of file performance_profiler.h.
References enabled_, and Get().
Referenced by yaze::gfx::PerformanceDashboard::RenderRecommendations().

|
inlinestatic |
Check if performance monitoring is enabled.
Definition at line 61 of file performance_profiler.h.
References enabled_, and Get().
Referenced by yaze::gfx::PerformanceDashboard::RenderRecommendations(), yaze::gfx::ScopedTimer::ScopedTimer(), and yaze::gfx::ScopedTimer::~ScopedTimer().

|
inlinestatic |
Check if the profiler is in a valid state (not shutting down) This prevents crashes during static destruction order issues.
Definition at line 69 of file performance_profiler.h.
References Get(), and is_shutting_down_.
Referenced by yaze::gfx::ScopedTimer::ScopedTimer(), and yaze::gfx::ScopedTimer::~ScopedTimer().

| void yaze::gfx::PerformanceProfiler::StartTimer | ( | const std::string & | operation_name | ) |
Start timing an operation.
| operation_name | Name of the operation to time |
Definition at line 34 of file performance_profiler.cc.
References active_timers_, enabled_, and is_shutting_down_.
Referenced by yaze::gfx::ScopedTimer::ScopedTimer().
| void yaze::gfx::PerformanceProfiler::EndTimer | ( | const std::string & | operation_name | ) |
End timing an operation.
| operation_name | Name of the operation to end timing |
Definition at line 40 of file performance_profiler.cc.
References active_timers_, enabled_, is_shutting_down_, operation_counts_, operation_times_, and operation_totals_.
Referenced by yaze::gfx::ScopedTimer::~ScopedTimer().
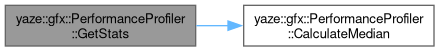
| PerformanceProfiler::TimingStats yaze::gfx::PerformanceProfiler::GetStats | ( | const std::string & | operation_name | ) | const |
Definition at line 63 of file performance_profiler.cc.
References yaze::gfx::PerformanceProfiler::TimingStats::avg_time_us, CalculateMedian(), yaze::gfx::PerformanceProfiler::TimingStats::max_time_us, yaze::gfx::PerformanceProfiler::TimingStats::median_time_us, yaze::gfx::PerformanceProfiler::TimingStats::min_time_us, operation_times_, operation_totals_, yaze::gfx::PerformanceProfiler::TimingStats::sample_count, and yaze::gfx::PerformanceProfiler::TimingStats::total_time_ms.
Referenced by GenerateReport().
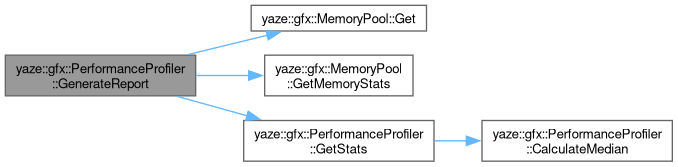
| std::string yaze::gfx::PerformanceProfiler::GenerateReport | ( | bool | log_to_sdl = true | ) | const |
Generate a comprehensive performance report.
| log_to_sdl | Whether to log results to SDL_Log |
Definition at line 95 of file performance_profiler.cc.
References enabled_, yaze::gfx::MemoryPool::Get(), yaze::gfx::MemoryPool::GetMemoryStats(), GetStats(), and operation_times_.
Referenced by yaze::gfx::PerformanceDashboard::RenderRecommendations().
| void yaze::gfx::PerformanceProfiler::Clear | ( | ) |
Clear all timing data.
Definition at line 179 of file performance_profiler.cc.
References active_timers_, operation_counts_, operation_times_, and operation_totals_.
Referenced by yaze::gfx::PerformanceDashboard::RenderRecommendations(), yaze::gfx::GraphicsOptimizationBenchmarks::SetUp(), and yaze::gfx::GraphicsOptimizationBenchmarks::TearDown().
| void yaze::gfx::PerformanceProfiler::ClearOperation | ( | const std::string & | operation_name | ) |
Clear timing data for a specific operation.
| operation_name | Name of the operation to clear |
Definition at line 186 of file performance_profiler.cc.
References active_timers_, operation_counts_, operation_times_, and operation_totals_.
| std::vector< std::string > yaze::gfx::PerformanceProfiler::GetOperationNames | ( | ) | const |
Get list of all tracked operations.
Definition at line 193 of file performance_profiler.cc.
References operation_times_.
| bool yaze::gfx::PerformanceProfiler::IsTiming | ( | const std::string & | operation_name | ) | const |
Check if an operation is currently being timed.
| operation_name | Name of the operation to check |
Definition at line 202 of file performance_profiler.cc.
References active_timers_.
| double yaze::gfx::PerformanceProfiler::GetAverageTime | ( | const std::string & | operation_name | ) | const |
Get the average time for an operation in milliseconds.
| operation_name | Name of the operation |
Definition at line 206 of file performance_profiler.cc.
References operation_counts_, and operation_totals_.
| double yaze::gfx::PerformanceProfiler::GetTotalTime | ( | const std::string & | operation_name | ) | const |
Get the total time for an operation in milliseconds.
| operation_name | Name of the operation |
Definition at line 218 of file performance_profiler.cc.
References operation_totals_.
| int yaze::gfx::PerformanceProfiler::GetOperationCount | ( | const std::string & | operation_name | ) | const |
Get the number of times an operation was measured.
| operation_name | Name of the operation |
Definition at line 223 of file performance_profiler.cc.
References operation_counts_.
| void yaze::gfx::PerformanceProfiler::PrintSummary | ( | ) | const |
Print a summary of all operations to console.
Definition at line 228 of file performance_profiler.cc.
References operation_counts_, operation_times_, and operation_totals_.
Referenced by yaze::editor::EditorManager::LoadAssets().
|
staticprivate |
Calculate median value from a sorted vector.
| values | Sorted vector of values |
Definition at line 257 of file performance_profiler.cc.
Referenced by GetStats().
|
private |
Definition at line 166 of file performance_profiler.h.
Referenced by Clear(), ClearOperation(), EndTimer(), IsTiming(), PerformanceProfiler(), and StartTimer().
|
private |
Definition at line 167 of file performance_profiler.h.
Referenced by Clear(), ClearOperation(), EndTimer(), GenerateReport(), GetOperationNames(), GetStats(), PerformanceProfiler(), and PrintSummary().
|
private |
Definition at line 168 of file performance_profiler.h.
Referenced by Clear(), ClearOperation(), EndTimer(), GetAverageTime(), GetStats(), GetTotalTime(), PerformanceProfiler(), and PrintSummary().
|
private |
Definition at line 169 of file performance_profiler.h.
Referenced by Clear(), ClearOperation(), EndTimer(), GetAverageTime(), GetOperationCount(), PerformanceProfiler(), and PrintSummary().
|
private |
Definition at line 171 of file performance_profiler.h.
Referenced by EndTimer(), GenerateReport(), IsEnabled(), SetEnabled(), and StartTimer().
|
private |
Definition at line 172 of file performance_profiler.h.
Referenced by EndTimer(), IsValid(), PerformanceProfiler(), and StartTimer().